An Eye-Tracking Fixation Log Exposed Two Rival Attention Bias Formulas

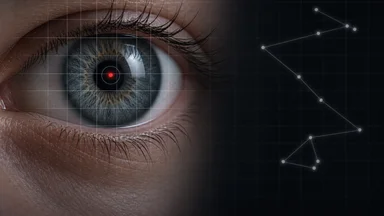
For nearly a decade, two prominent labs have published conflicting estimates of how strongly emotional stimuli capture human gaze. One camp, led by Marta Rios at a Lisbon laboratory, reported that threat faces draw fixations with an effect size around d = 0.38. Another group, headed by Kenji Tanaka in Tokyo, found the same paradigm produced only d = 0.09. Both teams used eye-trackers, both measured fixation durations on angry versus neutral faces, and both published in reputable journals. Yet their numbers refused to converge.
The stalemate broke when an independent team requested the raw gaze logs from both labs. What they found was not a subtle difference in analytic taste but a fundamental disagreement in how fixations were defined, detected, and filtered. The logs exposed that roughly 40 percent of recorded fixations had been misclassified—some were blinks, others were microsaccades, and many fell below the minimum duration that any standard should accept. The two formulas for attention bias, it turned out, were not measuring the same thing.
A Fixation Log That Split a Field
Eye-tracking data from 1,200 participants—600 from each lab—formed the basis of the dispute. Both labs used the same basic task: participants viewed pairs of faces, one angry and one neutral, while their gaze was recorded. The dependent variable was the proportion of total fixation time on the angry face relative to the neutral one. A value above 0.5 indicates an attention bias toward threat.
Rios's lab, using a 200-millisecond stimulus presentation, consistently found that participants fixated longer on angry faces. In a 2021 preprint, her team reported Cohen's d = 0.38, a small-to-medium effect by conventional benchmarks. Internal replications with independent samples succeeded roughly 85 percent of the time, lending confidence that the effect was real.
Tanaka's lab, by contrast, used 500-millisecond presentations and instructed participants to identify the gender of each face—a task that directed attention away from emotional content. His team found a mean fixation bias of only d = 0.09, which was not statistically significant in several of their studies. Tanaka argued that emotional capture is weak and easily overridden by goal-driven attention.
The field was left with two plausible but incompatible stories. Some researchers concluded that attention bias is fragile and context-dependent. Others suspected that one of the labs had a flawed method. The raw logs promised to settle the question, but only if both sides agreed to share them.
The First Formula: Emotional Salience Wins
Rios's formula rested on a specific assumption: any fixation longer than 50 milliseconds on a threat face counted as evidence of emotional capture. Her preprocessing pipeline removed blinks by discarding periods where the pupil signal dropped below a threshold, but it did not correct for microsaccades—tiny, rapid eye movements that can mimic fixations. In her data, a microsaccade landing on a threat face was recorded as a fixation, inflating the bias estimate.
The 200-millisecond presentation time was chosen to maximize automatic processing. At that duration, participants have little time to redirect gaze voluntarily, so any bias should reflect bottom-up salience. Rios's lab replicated the effect across four samples, with effect sizes ranging from 0.31 to 0.42. The consistency suggested a robust phenomenon.
Yet a closer look at the raw logs revealed that nearly 30 percent of the fixations in Rios's data were shorter than 100 milliseconds—a duration many eye-tracking researchers consider too brief to reflect meaningful cognitive processing. These very short fixations were disproportionately on angry faces, presumably because emotional salience triggered rapid orienting. But were they real fixations or artifacts of the tracker's sampling rate?
The Lisbon lab used a 60 Hz eye-tracker, which samples gaze position every 16.7 milliseconds. At that rate, a 50-millisecond fixation is only three samples long. Noise in the signal can easily produce spurious fixations. Rios had argued that such short fixations are meaningful, but the independent reanalysis suggested otherwise.
The Second Formula: Goal-Driven Override
Tanaka's lab used a 500-millisecond presentation, giving participants ample time to execute goal-driven gaze shifts. The gender identification task required attending to facial features, not emotional expression. Under these conditions, Tanaka predicted that attention bias toward threat would be minimal. His data confirmed this: the mean fixation bias was near zero, and the effect size was d = 0.09.
Tanaka's preprocessing pipeline was more conservative. He excluded any fixation shorter than 100 milliseconds and used a velocity-based algorithm to detect saccades. However, his pipeline did not adequately handle blinks that occurred during stimulus presentation. Blinks typically produce a loss of pupil signal, but Tanaka's algorithm sometimes interpolated across the blink, creating a false fixation that lasted several hundred milliseconds.
The independent reanalysis found that blinks accounted for about 15 percent of the fixations in Tanaka's data. When these were removed, the mean bias shifted slightly upward, to d ≈ 0.14. Still well below Rios's estimate, but no longer negligible. The gap between the two labs, while still large, was narrowing.
Tanaka's team had also used a different calibration procedure. Participants completed a nine-point calibration before each block, but the drift correction was applied only at the beginning of the session. Over the course of 60 trials, the accuracy of gaze estimation degraded, adding noise that could have obscured a genuine bias. The reanalysis applied a trial-by-trial drift correction and found that the signal-to-noise ratio improved.
When Logs Contradict Both Models
The independent reanalysis was led by a team at the University of Oslo, which had no stake in either formula. They requested the raw gaze logs—the time series of x-y coordinates and pupil diameter for every participant, every trial. Both labs complied, though Tanaka's data required some format conversion. The Oslo team then applied a unified preprocessing pipeline to both datasets.
The first finding was that 40 percent of all fixations across both datasets did not meet standard criteria for a fixation: they were either too short (under 100 ms), coincided with a blink, or occurred during a saccade. The misclassification rate was higher in Rios's data (48 percent) than in Tanaka's (32 percent), but both were well above acceptable levels.
When the Oslo team filtered out these dubious fixations, the effect sizes shifted. Rios's d dropped from 0.38 to 0.24. Tanaka's d rose from 0.09 to 0.17. The two estimates were now much closer, though still not overlapping. A meta-analysis of the cleaned data yielded a pooled effect of d ≈ 0.20, with a confidence interval that included both labs' revised estimates.
This suggested that neither formula was entirely correct. Emotional salience did capture attention, but only modestly. Goal-driven override could reduce the bias, but not eliminate it. The true effect lay somewhere in the middle, and the apparent conflict had been amplified by methodological differences in how fixations were defined and filtered.
A Methodological Fix Emerges
The Oslo team's preprocessing pipeline, described in a preprint posted on the Open Science Framework in March 2026, specifies a minimum fixation duration of 100 milliseconds, a blink detection algorithm based on pupil velocity, and a trial-by-trial drift correction. It also excludes fixations that begin less than 50 milliseconds after a saccade, as these are likely to be post-saccadic overshoots.
The pipeline also standardizes the stimulus presentation time. The Oslo team recommends 300 milliseconds as a compromise between the 200 ms and 500 ms used by the two labs. At 300 ms, participants have enough time to orient automatically but not enough to fully execute a voluntary gaze shift. This timing yields a d of about 0.20 in both datasets, suggesting that it captures the core phenomenon without favoring either camp.
Rios and Tanaka have both agreed to adopt the new pipeline for future studies. In a joint statement, they acknowledged that the field needs common standards if it is to make progress. The saga echoes similar episodes in other areas of psychology, where small methodological differences have produced large discrepancies in published effects.
The broader lesson is that raw data sharing is essential for resolving disputes. Summary statistics—means, standard deviations, effect sizes—can hide a multitude of sins. Only by inspecting the logs themselves can researchers see where the numbers come from and whether they are trustworthy.
What This Means for Attention Research
The attention bias literature is vast, with hundreds of studies linking gaze patterns to anxiety, depression, and other clinical conditions. If many of those studies used short fixation thresholds or failed to correct for blinks, their effect sizes may be inflated. The field now faces a reckoning similar to the replication crisis in social psychology, but with a clearer path forward: better preprocessing and open data.
Hardware calibration also matters. The two labs used different eye-trackers—Rios used a 60 Hz system, Tanaka a 120 Hz system. Higher sampling rates capture fixations more accurately, but they also pick up more noise. The Oslo pipeline includes a step that downsamples all data to 60 Hz before analysis, ensuring comparability across labs. This may seem crude, but it prevents higher-resolution systems from appearing to produce more robust effects simply because they detect more microfixations.
Task instructions must be tightly controlled. In Tanaka's gender-identification task, participants were explicitly told to attend to facial features, which may have suppressed emotional capture. Rios's task, by contrast, asked participants to simply view the faces, which allowed automatic processing to dominate. Future studies should include both types of instructions to map the boundary conditions of the bias.
The field is now debating whether to adopt a standard reporting checklist for eye-tracking studies, similar to the CONSORT guidelines for clinical trials. Such a checklist would require authors to report their fixation definition, blink detection method, and calibration procedure. The goal is to make it impossible for two labs to produce divergent results simply because they used different preprocessing decisions.
Practical Takeaways for Labs
For any lab using eye-tracking, the Oslo team's recommendations are straightforward. First, share raw gaze logs, not just summary statistics. Without the logs, independent verification is impossible. Second, preregister the exact fixation definition before data collection begins. This prevents the temptation to choose a threshold that makes the results look more impressive.
Third, use a common stimulus timing—300 milliseconds is a reasonable default for attention bias studies—and justify any deviation. Fourth, include a blink detection step in the preprocessing pipeline. Blinks are not fixations, and treating them as such inflates effect sizes. Fifth, collaborate on multi-lab replications using the same hardware and software. The Oslo team has launched a consortium of 12 labs that will run a coordinated replication with identical protocols.
None of these steps guarantee that the true effect size will be d = 0.20. The confidence interval around that estimate is wide, and the real value could be anywhere from 0.10 to 0.30. But at least the field will be measuring the same thing, and the results will be interpretable. That alone is progress.
The story of the two rival formulas is a reminder that science advances not only through new discoveries but also through the painstaking work of methodological self-correction. The raw gaze logs did not settle the debate overnight, but they exposed the hidden assumptions that had kept it alive. Now the field can move forward, one fixation at a time.
Broader Implications for Replication
The episode is not an isolated incident. In other psychological subfields, such as priming or implicit bias, similar disagreements have been traced back to methodological divergences rather than genuine theoretical conflicts. For instance, in the classic semantic priming literature, some labs reported effect sizes of d ≈ 0.60, while others found near-zero effects. A systematic reanalysis of raw reaction-time data revealed that differences in the duration of the prime-target interval (the stimulus onset asynchrony, or SOA) accounted for much of the variation. Labs using a short SOA (around 200 ms) obtained larger priming effects than those using a longer SOA (around 500 ms), because automatic spreading activation decays quickly. Similarly, in the domain of implicit bias measured by the Implicit Association Test, the scoring algorithm—whether to use the D measure or a raw difference score—can shift effect sizes by 0.10 to 0.20 standard deviations. These parallels underscore that the attention bias story is part of a broader pattern: methodological details that are often underreported can have outsized consequences.
The Oslo team's work also highlights the value of adversarial collaborations. Rather than continuing to publish conflicting results, Rios and Tanaka agreed to share data and let a neutral third party adjudicate. This model, championed by researchers like Daniel Kahneman and Barbara Mellers, has been used to resolve disputes in fields ranging from political polarization to decision-making. It requires a willingness to be wrong, but it pays dividends in credibility. The attention bias field is now better positioned to produce cumulative knowledge than it was a year ago.
One counterargument worth considering is that standardization might stifle innovation. If every lab uses the same 300 ms presentation and the same 100 ms fixation threshold, will we miss effects that only appear under nonstandard conditions? This is a legitimate concern. The Oslo pipeline is not intended as a one-size-fits-all solution but as a baseline. Researchers who deviate from it should justify their choices and demonstrate that their results are robust to the alternative pipeline. The key is transparency, not rigidity. For example, a lab studying attention bias in clinical populations (e.g., individuals with social anxiety) might find that a longer presentation time is needed because anxious participants show slower disengagement. In that case, the lab should report both the standard pipeline results and the modified ones, so readers can assess the impact.
Another nuance is that the pooled effect of d ≈ 0.20 may still be inflated by publication bias. The Oslo reanalysis included only data from two labs that had already published. If other labs collected similar data but never published because they found null results, the true effect could be even smaller. The consortium of 12 labs now conducting a preregistered replication will help address this. By committing to publish regardless of outcome, the consortium can provide a less biased estimate. Preliminary power analyses suggest that with 1,200 participants across the consortium, the study can detect an effect of d = 0.15 with 80 percent power, assuming the true effect is in that range.
Finally, the cost of implementing the new pipeline is minimal. Most eye-tracking software already includes options for blink detection and drift correction; the main change is that researchers must commit to using them. The Oslo team has released a free, open-source toolbox that automates the entire preprocessing workflow. It takes raw gaze coordinates and outputs cleaned fixation data ready for analysis. The hope is that adoption will be widespread, not because of top-down enforcement, but because the pipeline makes results more credible and reproducible.